The 2026 Pickleball Travel Industry Report
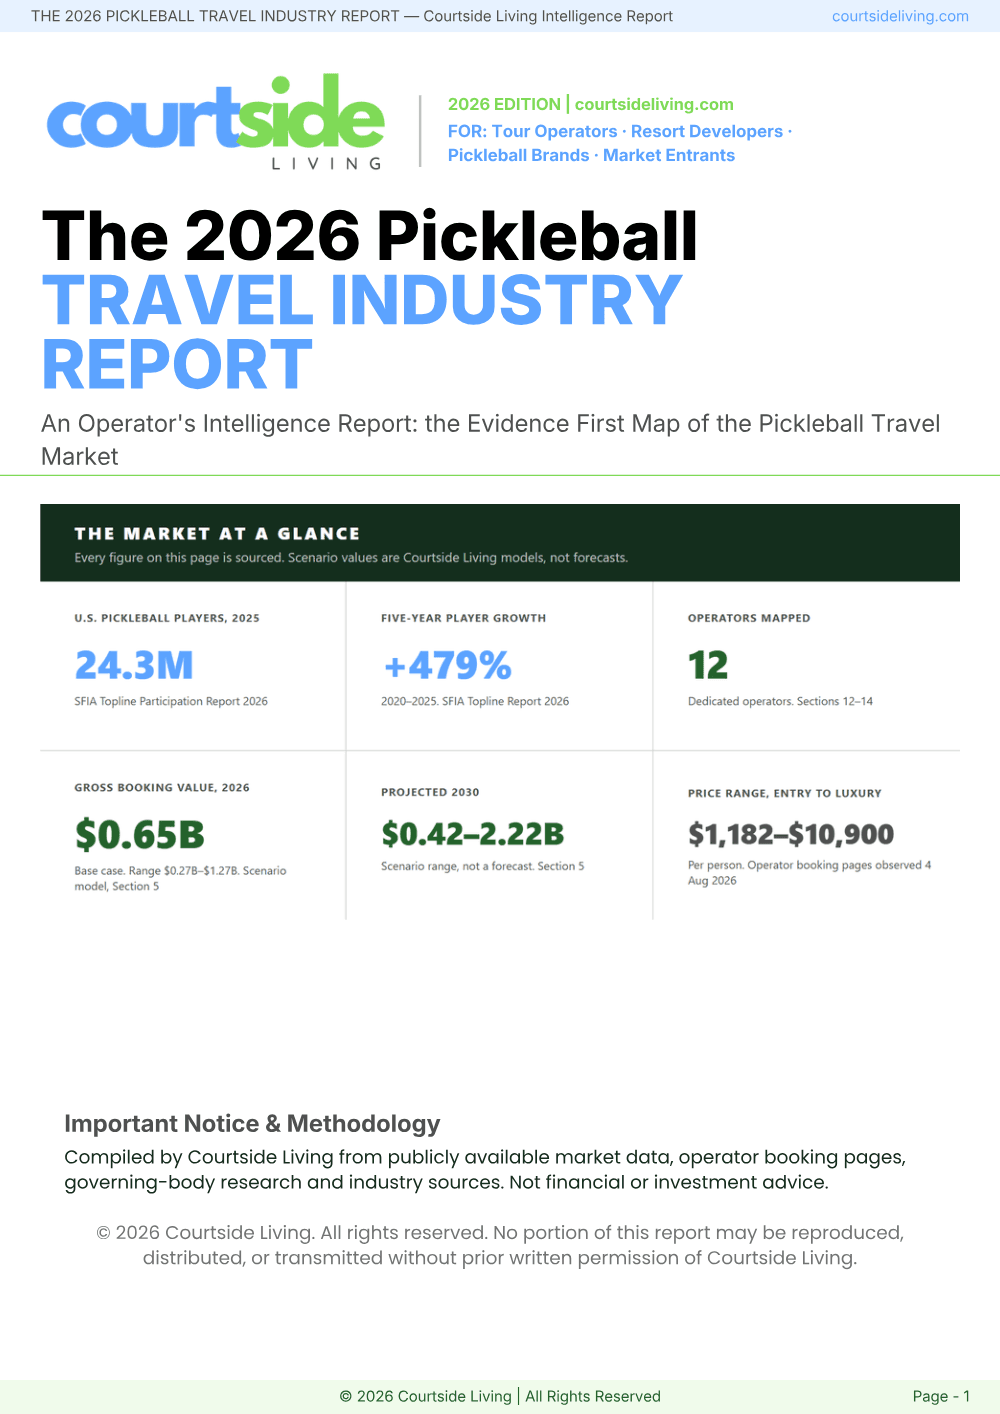
Every market claim tested against live supply. 63 pages on who sells pickleball travel, who buys it, what a trip really earns once it is staffed properly, and which of the famous gaps are already occupied.

- 63
- pages
- 30
- sections
- 12
- operator profiles
Handled by Stripe. Download immediately, link emailed too.
The hype is free. The verification is the product.
Those numbers are real, published, and everywhere. What nobody publishes is what happens after them: how big the travel market actually is, which of the famous gaps are already occupied, and what a trip really earns once it is staffed properly.
So we checked. Every gap claim is tested against live operator supply, and every price was read from a live booking page on a stated date.
Some findings will not flatter the category. The market is smaller than the hype says. And there is an awkward middle: a 20 person trip earns a thinner margin than either a small intimate trip or a full 40 person departure, because you have hired a second coach but not yet filled the seats.
Six celebrated market gaps. Three of them already have operators in.
Each gap was tested against live supply rather than repeated. The report names which three are occupied, who occupies them and what they charge, and what supply actually exists in the three that remain thin.
Thirty sections. Everything needed to evaluate, launch and scale.
- Market sizing: a fully disclosed scenario model, $0.27B to $1.27B for 2026, every assumption printed on the page.
- Twelve operator profiles: founding, model, pricing, destinations, each verified at the operator's own source.
- Five business model archetypes, with capital requirements, moat and risk economics.
- Four traveler personas with conversion triggers, labelled as our estimates rather than as findings.
- Pricing benchmarks: $1,182 to $10,900 per person, observed on live booking pages on 4 August 2026.
- The six market gaps, each named, with the evidence behind its grading.
- Destination framework covering the domestic and international matrix.
- Pro and coach integration: structures, certification, and realistic rate ranges.
- Group size economics: the profit and loss at real staffing ratios, including the configuration that loses money.
- Brand partnership playbook across four tiers, with FTC disclosure requirements built in.
- A phase by phase launch roadmap, plus the operating metrics to track from the first trip.
- The trip sellout formula: email sequence, genuine scarcity, and waitlist strategy.
How every figure is handled
- Primary sources only, cited to the organisation that collected the data.
- Observed prices carry the date they were read, printed beside the number.
- Model inputs are labelled published, observed or assumed. All of them.
- Where a figure could not be verified at its source, the report says so rather than printing it.
What it is not
- Not a custom study. Every buyer receives the same 63 page PDF. For research on your own local market, see the Competitive Intelligence Report.
- Not a forecast of your business. It reports what public sources say, and names the places where the data does not exist.
- Not a subscription. One payment, one file, yours to keep.
Tour operators
Entering or expanding in pickleball travel.
Resort developers
Evaluating pickleball as a revenue driver.
Pickleball brands
Building travel channel partnerships.
Market entrants
Validating the opportunity before spending on it.
Two companies, one report.
Net Gains IQ
netgains-iq.com
A specialized research, market intelligence and strategic advisory platform serving the pickleball industry. We develop customized, source cited reports that turn fragmented market information into clear, actionable business intelligence.
Our work spans competitive facility analysis, market and category research, consumer and travel insights such as this report, and brand strategy, including the 2026 Athlete Sponsorship in Pickleball guide produced for Rally Up Pickleball.
Courtside Living
courtsideliving.com
A dedicated pickleball travel marketplace that helps players discover, compare and book curated pickleball vacations and experiences.
It connects travelers with qualified independent tour operators, and gives those operators greater visibility through featured listings, social media, email marketing and the broader Net Gains ecosystem.
Questions
- When do I receive it?
- Immediately. The download link appears the moment your purchase completes, and it is emailed to you as well so you can find it later.
- What do I actually get?
- A 63 page PDF across 30 sections, with charts, tables and operator profiles throughout. One payment, one file, yours to keep.
- Which sources does it rest on?
- Participation comes from SFIA's 2026 Topline release and USA Pickleball's 2025 Annual Growth Report. Operator pricing was read from live booking pages on 4 August 2026. Primary sources only, each cited to the organisation that collected the data.
- Is this a hype piece?
- No, and that is the point. Where the evidence undercuts a popular claim, the report says so plainly, names the operators involved and prints their prices. You are paying for the checking.
Buy the map before you pay the tuition.
The advantage is not secret gaps. It is knowing exactly what is occupied, what is thin, and what the economics demand before you commit capital.
Handled by Stripe. Download immediately, link emailed too.